The Grand Blunt Wizard
Active Member
So I make my own LED's and I"m looking at starting my own company. I just got my spectroradiometer and I thought I'd share the data I gathered from my flower room, veg room, and a a 600w HPS.
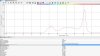
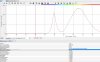
The first image is a screenshot of my flower spectrum, second is my newest veg spectrum, and last is a 600w HPS. I just started messing with the software so I'm honestly not sure if the irradiance data at the bottom is accurate and I have no idea what the y-axis is, but it seems to be showing at least relative spectral output.
I was really happy with my flower spectrum and also pleased with my veg spectrum.
Any comments, suggestions, or anyone who knows how to run OceanView software would be appreciated.
-Photon Fantom

 What they call "Intensity" is normally called "Relative Spectral Power Distribution"