WeeblesWobbles
Well-Known Member
Ok I'm boarding, see y'all later.
But what are you doing to better yourself in the here and now? 50% of the country is kicking ass and taking names, why aren't you joining the party!
That is an outrageous claim that certainly needs citation to support.
To be exact, you claim that 50% of the United States population, eg. roughly 160,000,000 individuals are, "kicking ass and taking names".
You most definitely need to substantiate that claim.
Ok. Clearly you don't know how to cite your claims. When you make a claim, as outlandish as yours, you need to cite supporting evidence to that fact. Your feeble attempt at diversion only shows us you incapable of rational thought. It's no wonder nobody takes you seriously?Didn`t more than half this Country re-elect Obama, the greatest president that ever lived ? Is that not kicking ass and taking names ?
Out of two candidates, doesn`t one win by getting more votes than the other ? Did Obama not win or something ?Ok. Clearly you don't know how to cite your claims. When you make a claim, as outlandish as yours, you need to cite supporting evidence to that fact. Your feeble attempt at diversion only shows us you incapable of rational thought. It's no wonder nobody takes you seriously?
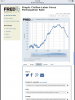
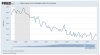
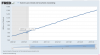
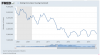
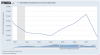
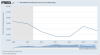
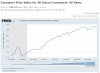
Please provide a link to these charts. I can't seem to find them as you've shown them.Uhh...I voted for him too, but only once. And I think you're forgetting the midterms. From the Federal Reserve Economics Database (FRED). Check it out sometime, it's pretty fascinating.View attachment 3589245
That's not the question posed to you. You have very poor reading comprehension.Out of two candidates, doesn`t one win by getting more votes than the other ? Did Obama not win or something ?
you could win election and not win popular vote by the way the electorial vote is set upOut of two candidates, doesn`t one win by getting more votes than the other ? Did Obama not win or something ?
Still had more Electoral though.you could win election and not win popular vote by the way the electorial vote is set up
Wasn`t that the Gore claim ?you could win election and not win popular vote by the way the electorial vote is set up
That's not the question posed to you. You have very poor reading comprehension.
I still enjoy your posts more than others because they`re either very funny or very damaging and that equals good reading.That's not the question posed to you. You have very poor reading comprehension.
I agree.I still enjoy your posts more than others because they`re either very funny or very damaging and that equals good reading.
While you can register and save queries and plots, I didn't run them ^^^ myself. It's the typical pissing-contest graphic posted on Zero Hedge. I did check out their veracity, though. You can duplicate them yourself if you use the same time range but just recreating them to include the 4Q2015 data is probably more instructive anyway. (Kind of fascinating watching women enter the workforce in the '70s). It's particularly interesting to remove the fudge factors (e.g. "Seasonal adjustment" in the unemployment rate) and look at the raw data before it's Politburo'd into a more palatable presentation.Please provide a link to these charts. I can't seem to find them as you've shown them.