wietefras
Well-Known Member
Sorry, but that really is just marketing nonsenseBingo
The light is so intense we wanted to add just a bit more blue to push the stomata open.
Sorry, but that really is just marketing nonsenseBingo
The light is so intense we wanted to add just a bit more blue to push the stomata open.
Does this mean that the SPD chart for the individual diablo qbs is wrong? With that blue spike that goes to the top of the graph? Anybody?The 648+ datasheet is completelywrong lol. That one shouldn't even be published lmao. It says 3500k we are using 4k lmao. I will have them send the correct one soon.
Does this mean that the SPD chart for the individual diablo qbs is wrong? With that blue spike that goes to the top of the graph? Anybody?
Thanks.


The ones I posted above were from 3rd party reports. With exception of SANLIGHT. Yours are derived from promotional literature, that could be outdated or superseded by component change.Lol yeah he knows how to fudge the numbers. But then they say: "Yield is na gonna be thure"
So yes, don't be fooled my manufacturers who sneakily try to increase their numbers knowing that there will be no yield coming from it. Especially by manufacturers who lament this practice by other manufacturers and then do it themselves!
That chart for Fluence is their greenhouse light though. So, also fake news. For indoor growing Fluence uses PhysioSpec Indoor™ spectrum and that is more properly red biased.
View attachment 4603774
Still a tad too blue I would say, but much better.
..........


Thanks.HLG Stephen talks a little about how competitors push the µmol/j numbers up by using higher Kelvin cct in their products. Around the 1 hour mark.
View attachment 4603565
View attachment 4603568
View attachment 4603571
View attachment 4603576
For contrast we could look at this masterpiece by SANLIGHT. I wonder what their µmol/j figure is?
View attachment 4603578
My question is who came up with “white light” is full spectrum? It’s great for human eyes but not best for plant growth
Could be, however Fluence specifically mention different SPDThe ones I posted above were from 3rd party reports. With exception of SANLIGHT. Yours are derived from promotional literature, that could be outdated or superseded by component change.
Actually "full spectrum" is term made up when led light manufacturers were using only red and blue leds. Some manufacturers started adding other wavelengths to fill up the gap between blue and red (sometimes also adding UV and infrared) and called their lights full spectrum.My question is who came up with “white light” is full spectrum? It’s great for human eyes but not best for plant growth
Actually "full spectrum" is term made up when led light manufacturers were using only red and blue leds. Some manufacturers started adding other wavelengths to fill up the gap between blue and red (sometimes also adding UV and infrared) and called their lights full spectrum.
Calling white led light "full spectrum" really isn't very common. Where did you see that?
This is from op of this thread very first post
Thanks.
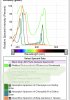
If you compare the relative intensity of the hlg 650r light lab test spd chart (that you just shared) to the spd chart on the hlg website the blue peak is much higher. Looks like "7.5" on the light lab, versus "9.8" on the hlg site.
Am I missing something? I thought what I just heard from Stephen is that the spd chart on the hlg website is completely wrong...
So is it? And is the lighting lab inc. test you just shared correct then?
That would make a pretty big difference...
Thanks anyone.
Could be that the chart on the website the one supplied by Samsung? Which is why it could be wrong... remember what they did with the data sheet. Either way I didn’t catch that until after you mentioned itThanks.
If you compare the relative intensity of the hlg 650r light lab test spd chart (that you just shared) to the spd chart on the hlg website the blue peak is much higher. Looks like "7.5" on the light lab, versus "9.8" on the hlg site.
Am I missing something? I thought what I just heard from Stephen is that the spd chart on the hlg website is completely wrong...
So is it? And is the lighting lab inc. test you just shared correct then?
That would make a pretty big difference...
Thanks anyone.
Ah, I didn't notice that. I don't know what the difference is though either, hah.one has relative intensity on the Y axis and the other has normalized power


Could be I'm wrong - as someone just pointed out that the graphs are actually 'different'. I didn't catch anything then I guess, I thought that's what was being referenced when Stephen said the datasheet was wrong. But I duno now.Could be that the chart on the website the one supplied by Samsung? Which is why it could be wrong... remember what they did with the data sheet. Either way I didn’t catch that until after you mentioned it
Ah, I didn't notice that. I don't know what the difference is though either, hah.
I'd wanna know if that spd on the left is correct. And I guess I'll see if I can find out what "normalized power" is.
View attachment 4604025View attachment 4604028